Bar Chart Icon
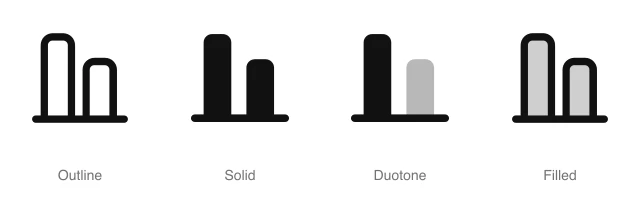
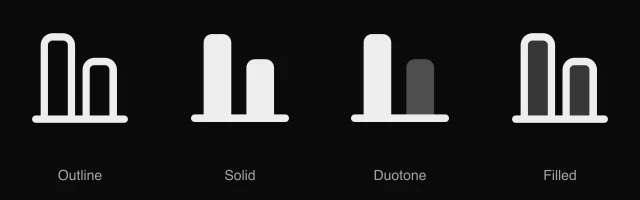
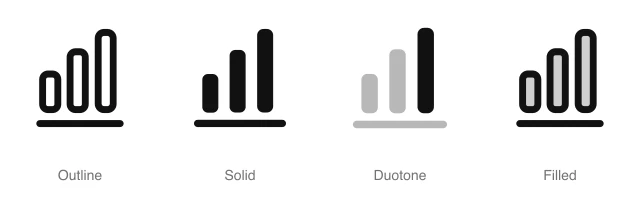
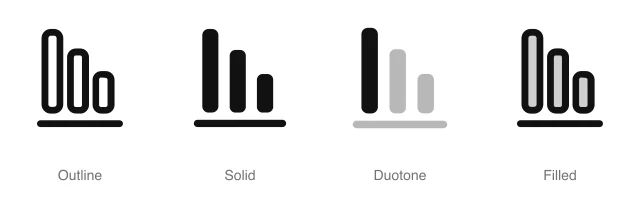
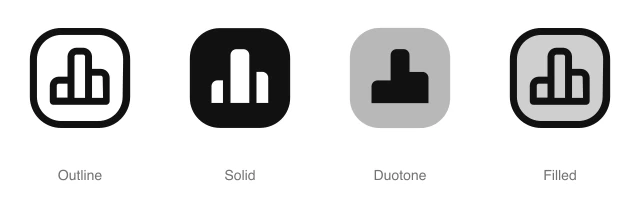
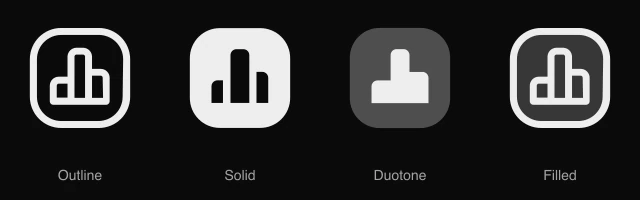
Two vertical bars on a baseline, the left one taller, for bar charts, statistics and comparison views. Available in 4 styles (outline, solid, duotone and filled) as a React component you install with the shadcn CLI.
Preview
- 16px
- 20px
- 24px
- 32px
Install and code
Bar Chart icon in shadcn/ui components
Button
Icon button
Button group
Dropdown menu
Input group
Sidebar
Empty state
Bar Chart icon FAQ
What does this icon show?
Two vertical bars on a baseline, the left one taller, for bar charts, statistics and comparison views. Typical uses: switch to chart view in analytics, statistics tab in a dashboard and compare two values in a report.
When should I use it instead of a similar icon?
Use it for:
- Budget against actual and plan against result views, where exactly 2 values stand side by side
- Period compare toggles on a revenue or usage card, such as this month next to last month
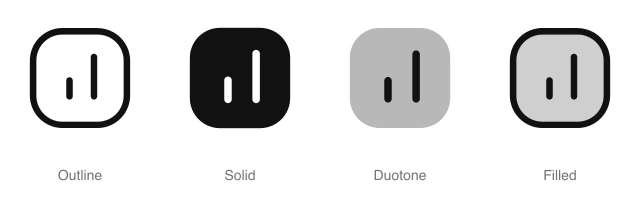
For ranked values sorted largest first, such as top products by revenue, use the Chart Bars Descending icon. For values across 3 or more categories in a stats card, such as sales by channel, use the Chart Simple icon. For an analytics or reports entry in a sidebar of boxed glyphs, use the Chart Bars Square icon.
Which styles does it come in?
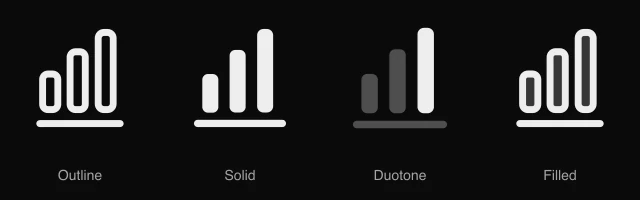
4 styles: Outline, Solid, Duotone and Filled. Every style is drawn on the same 24 by 24 grid and installs as its own file, so you can switch styles without touching the layout.
How do I install it with the shadcn CLI?
Copy the install command from the panel above, in the style you want, and run it in your project. The shadcn CLI adds the icon as a React component that you import and render like any other. It draws in the current text color, so your text color and size classes style it. Icon installs need a ReUI Ultimate license.
What icons go well with it?
Icons from the same family and the Charts set: Building Chart, Chart, Chart Arrow Down, Chart Arrow Up, Chart Bars Ascending and Chart Bars Descending.
When was it added?
It joined the ReUI icon library on June 30, 2026.
Icons related to Bar Chart
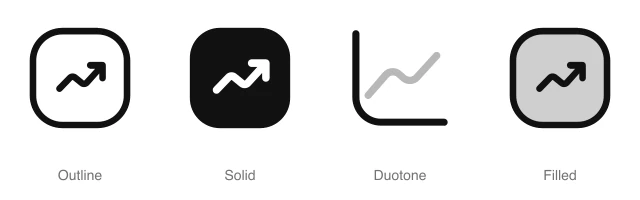
For AI Agents
Hand your agent this brief or the ReUI MCP, not a screenshot. Installs with a ReUI Ultimate license.
When to use
- Budget against actual and plan against result views, where exactly 2 values stand side by side
- Period compare toggles on a revenue or usage card, such as this month next to last month
When not to use
- Ranked values sorted largest first, such as top products by revenue: use the Chart Bars Descending icon
- Values across 3 or more categories in a stats card, such as sales by channel: use the Chart Simple icon
- An analytics or reports entry in a sidebar of boxed glyphs: use the Chart Bars Square icon
Agent notes
- Name an icon-only button with its label, "Compare periods", as the aria-label
Markdown
https://reui.io/icons/preview/bar-chart.mdMCP
get_icon("bar-chart")Install
npx shadcn@latest add @reui/icons/default/duotone/bar-chartStart building with ReUI Pro today.
Every Pro block, every style, and every future addition, with one license for unlimited projects.
Get All-Access
From $249, once. Lifetime updates.